|
|
 |
Market Commentary
Fiscal 2004 could be well titled "Great Expectations." As September 2003 began, the world was still honeymooning over the economic relief provided by a liberated Iraq, an accommodating world banking system, and an only mildly challenging hurdle of earnings expectations based on depressed prior year results. Whether at home or abroad, such macroeconomic expectations proved uplifting to stocks of all kinds for the first half of the year. The U.S.-oriented S&P 500 and Russell 2000 (small cap) stock indices rose 14.59% and 18.36%, respectively, while the international markets were even more impressive with the Developed International and Emerging Markets stock indices rising 25.33% and 27.86%, respectively, through February of 2004.
April 2004, however, heralded a new environment, as strong U.S. payroll gains triggered concerns that the Federal Reserve would soon reverse their policy accommodation of low 1.0% interest rates. This caused a dramatic upward move in U.S. interest rate expectations and rates with the 10 year Treasury note rising from 3.65% on March 17 to 4.90% by May 14. These events caused several beneficiaries of the prior "easy money" policy - namely Emerging Markets and small cap global equities and REITs (Real Estate Investment Trusts) - to suffer considerable near term performance setbacks. Additionally, the surge of 'hot' or short term money from speculative institutional and retail investors exacerbated this poor performance as they exited these assets 'en masse' in April and May. For the period from April 2 (the first strong payroll release) through May 17, the Russell 2000, the Morgan Stanley REIT, and the MSCI Emerging Markets equity indices fell, -11.18%, -15.42% and -18.44%, respectively.
Amidst this backdrop, oil prices had started to gradually rise from the $26.65/barrel levels they had reached on September 19, 2003. With the conclusion of the Iraq War it was widely expected that a recurring, unencumbered flow of oil from the Mideast could start anew and oil prices would gradually decline. However, with isolated cases of pipeline sabotage and the regular growing demands of emerging economies around the world, a slow steady ascent of the commodity price began - reaching a peak of $49.40/barrel on August 20, before closing the year at $42.12/barrel. This event, coupled with the Federal Reserve's two 25 basis point interest rate hikes in June and August, placed a big question mark over the ability of global economies to sustain above average growth rates going forward.
The year that began with "great expectations", closed on a less sanguine note, with concerns about the state of worldwide growth, rising inflation, interest rates, skyrocketing oil prices, and the uncertainty of the upcoming U.S. presidential election. While the S&P 500, Russell 2000, Developed International and Emerging Markets equity indices all closed with double digit gains, these were well off of their highs for the year and momentum remained to the downside as the year drew to a close. In sum, the real winners for the year were "real" assets such as REITs and Commodities (oil) which were up near 30% over the twelve month period.
Just as in fiscal year 2003, these disparate investment environments proved challenging from an investment management perspective. However, by maintaining a diversified asset exposure - including a meaningful allocation to REITs, Commodity futures, and hedge funds - along with strategic and timely rebalancing out of winning asset classes during the year, the endowment funds were able to effectively capitalize on the investment landscape of the last twelve months. The overall result was the second consecutive year in which the funds earned
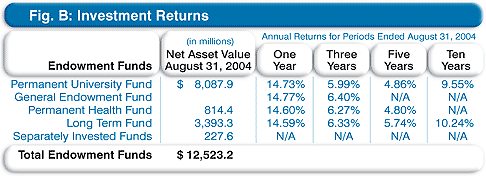
double digit investment returns, as reflected in Figure B.
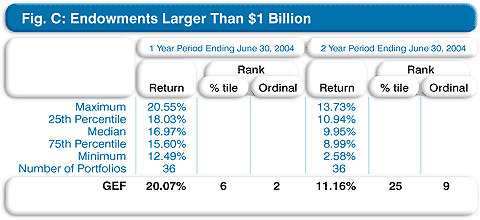
The endowment funds' performance also compared very favorably to performance at other large endowment funds in the United States. Figure C shows that the GEF ranked 2nd (the 6th percentile in a universe of 36 endowments larger than $1 billion in total assets) for the one year period ending June 30, 2004 (the latest data available) and 9th over the two year period.
Portfolio returns are derived from the marketable and non-marketable investments asset categories of the portfolios.
Marketable assets. For the year, UTIMCO's marketable endowment assets enjoyed a return of 15.01% - strongly ahead of the benchmark result of 12.42% - resulting in a net value-added to the endowment funds of approximately $228 million.
In the first half of the year, UTIMCO's public marketable asset classes took advantage of the market environment by retaining strategic overweights to REITs and U.S. and global equities. In addition, strong overweights to small cap and emerging markets stocks assisted in these efforts as these assets thrived under the highly liquid macroeconomic environment. As early as January 2004, however, UTIMCO began efforts to remove the small cap bias from the U.S. equity accounts and to reallocate assets away from REITs - both of which had provided considerable value since the Iraq War's end in March of 2003. In particular, UTIMCO's constructive use of a derivatives trade to effect the transfer of small cap to large cap exposure allowed the endowment funds to retain the return of the endowments' active small cap managers, while cost-effectively using passive instruments to change the size exposure only.
The post-March environment was also a busy period at UTIMCO with the public market's staff making new allocations to TIPS (Treasury Inflation Protected Securities), increasing exposure to GSCI futures and hedge funds, and making further reductions to our strongly performing REITs portfolio. By fiscal year end, UTIMCO's public markets investment staff had completed a timely, methodical, and cost-effective transition to a portfolio more closely aligned with our long-term policy allocation and better suiting the endowment funds for the current uncertain macroeconomic landscape. Returns for the year in the public markets were driven by very strong absolute and relative performance in the commodity (+24.2%), and domestic (+13.7%) and international equity (+19.5%) asset categories.
The marketable alternative investment staff was also instrumental in the strong performance of the marketable asset class. Despite the turn in fortunes in the markets late in the fiscal year, the marketable alternatives portfolio (hedge funds) provided a solid return of 12.23% for the year and experienced only one down month, posting a modest loss of -0.60%. Our marketable alternative investments consist of absolute return and equity hedge fund managers, and in some cases market futures to create a more optimal portfolio mix. The staff made $491.5 million in investments to the marketable alternative portfolios during the year.
Absolute return hedge fund investments include primarily multi-strategy managers focused on arbitrage and event oriented strategies such as distressed debt, spin-offs, and recapitalizations. Our absolute return managers found opportunities in special situation equities and reduced their distressed debt exposure over the year. The absolute return managers contributed 56% of the 12.23% total return for the year. Equity hedge fund investments include U.S. and international long/short equity strategies. These strategies attempt to exploit profits from stock selection skills by taking long and short positions in various equity securities. As a group, the equity hedge investments contributed 26% of the 12.23% total return for the year. The remaining 18% of the portfolio's 12.23% return is attributable to the portfolio's exposure to S&P 500 futures, put in place in the late part of 2003 and early 2004 to take advantage of the strong recovery in the equity markets during that period.
Non-marketable assets. The endowment fund's non-marketable portfolio also witnessed a favorable year as private equity and venture capital continued their recoveries in fiscal 2004. In the fourth quarter of 2003, the U.S. Venture Capital Venture Economics' Index posted its first positive annual return in three years, an indication that the asset class is rebuilding from the bursting of the technology bubble at the beginning of the decade. Relatively low valuations in early stage companies presented attractive investment opportunities, and active Mergers and Acquisitions (M&A) and Initial Public Offerings (IPO) markets generated strong returns for later stage companies. Sixty-eight venture-backed companies raised $4.5 billion through IPOs from July 2003 through June 2004, according to Thomson Venture Economics and the National Venture Capital Association (NVCA). This activity was more than seven times the prior year's total of eight venture-backed IPOs and represented the most IPOs since the third quarter of 2000, when eighty-seven venture-backed companies went public in that quarter alone. Google's IPO in August of 2004 was the most anticipated liquidity event of the year, creating billions of dollars in value for its venture capital investors.
An expansion of the lending markets drove U.S. leveraged buyout (LBO) activity to record levels. Through August 31, 2004, over $174 billion of debt and equity had been invested in LBOs, more than any year in U.S. history. Buyout firms took advantage of the strong credit markets to generate liquidity from their portfolio companies through recapitalizations. UTIMCO's investment managers took part in the opportunity to generate liquidity and returned $294 million, or 35% of the private capital portfolio, to the PUF, and $124 million, or 32% of the private capital portfolio, to the GEF. The overall annual returns on the PUF's and the GEF's private capital portfolios were 13.03% and 12.14%, respectively. This compared to a Venture Economics benchmark of 17.63%. The shortfall was largely driven by the PUF's lack of venture capital exposure relative to the benchmark during the strong technology market of the mid to late nineties. In addition, a significant portion of the private capital portfolio was invested in the last several years. Given that returns are typically understated during the early years of a private capital fund as capital is drawn and invested, we expect returns on the portfolio to increase as these recent investments mature.
Due to the long-term nature of private capital investing, returns are typically measured over a longer time period, using a methodology called "Since Inception Internal Rate of Return" or IRR. The private capital portfolio has earned an IRR of 10.21% since the inception of the program in 1983. If the amounts invested in private capital had instead been invested in the public markets (using the Russell 3000 as a proxy), the IRR would be 4.99%. This indicates that the private capital portfolio has outperformed the public markets by 5.22% per year over the 23 years since the inception of private capital investments by UTIMCO and its predecessors.
|